Dashboard
The Dashboard is the first page you see when you open Components > Next Inventory. It's a read-only analytics view that answers five questions in one screen: how much inventory is worth, how many items do we carry, how many warehouses are active, what's running low, and what just happened.
Everything on this page is derived live from the underlying transaction log and item records — there's nothing to configure and no data to edit from the dashboard itself.
For Users
Reading the KPIs
Four KPI cards span the top of the page:
- Total Value — live stock valuation: each published item's stock
quantity multiplied by its unit price, summed across the whole
inventory. Uses the currency configured in
Settings and switches to compact
notation (
$1.2M,$500K) when the number gets long. - Total Items — count of published item records (not a sum of stock quantities — for that, check Reports).
- Warehouses — how many warehouses are currently published.
- Low Stock — count of items currently at or below their low-stock threshold, with a live percentage of total inventory alongside.
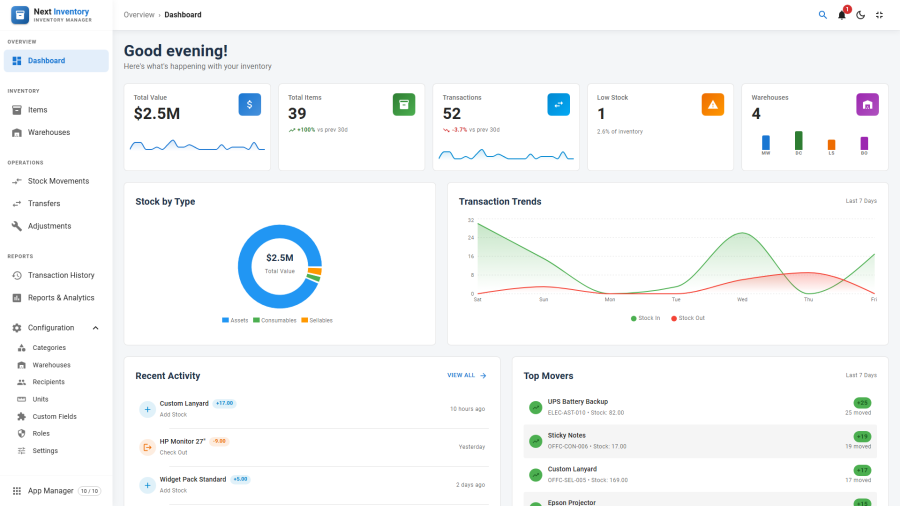
The number on the Low Stock card is also the ground-truth count that drives the red bell badge on the top bar — if it says 3, three items need reordering attention right now.
Charts
Two charts sit under the KPI row:
- Stock By Type — doughnut / bar breakdown of total value by item type (Asset / Consumable / Sellable). Useful for at-a-glance "where's the money?" answers.
- Mini Trends — a sparkline of stock-level changes over the recent period. Full trend analysis with date-range selection lives on Reports.
Widgets
Three side-by-side widgets finish the page:
- Recent Activity — the last handful of transactions in reverse chronological order, each showing the item, action, recipient (if any), and user. Click through to open the transaction or the item.
- Top Movers — items with the highest transaction velocity over the last period. A good sanity check when you want to know which items are churning the fastest.
- Low Stock — every item currently below its threshold, with the shortfall highlighted. Only shown when there is at least one low-stock item (so you don't get an empty panel when everything is fine).
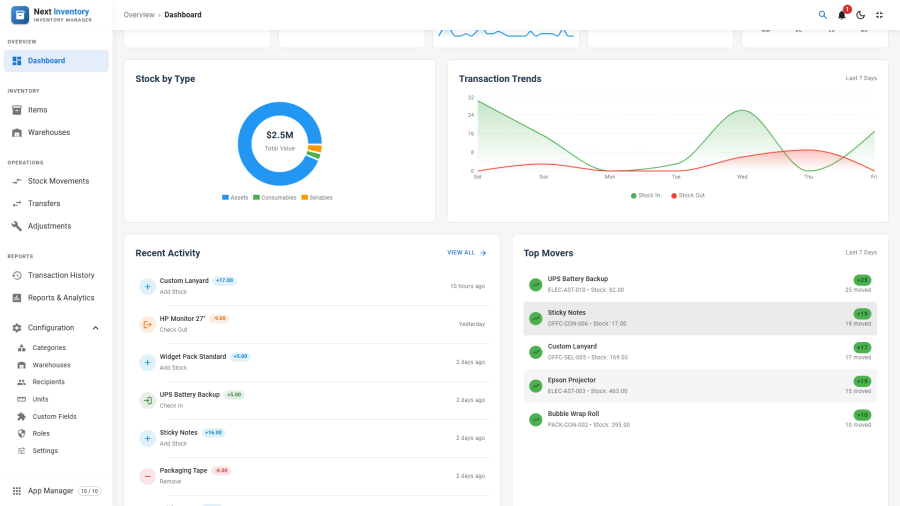
On mobile the layout stacks vertically — KPIs first, then charts, then widgets — with compact spacing so you can reach everything with your thumb.
For Admins
The Dashboard itself has no configuration. What controls what shows up is elsewhere:
- KPIs and widgets respect the
inventory.viewandreports.viewpermissions. A user withoutreports.viewwill see the item list widget but not the stock-valuation number. - The Low Stock widget is driven by each item's Low Stock Threshold field. Items with no threshold set never appear here, regardless of how little stock they have.
- "Recent Activity" is the transaction history. It only fills up as stock movements are recorded — on a fresh install (or right after resetting demo data) the widget stays empty until the first transaction is saved.
- Valuation figures depend on unit prices being filled in. Items with a zero unit price contribute zero to the valuation charts — tell your team to keep unit prices current or the numbers understate.
Permissions
| Action | Feature | Permission |
|---|---|---|
| See the Dashboard | always visible when Next Inventory loads | — |
| See the Total Value KPI | reports |
view |
| See the Low Stock widget | inventory |
view |
| Click through to an item | inventory |
view |
| Click through to a transaction | transactions |
view |
Edge Cases
- Stale charts after bulk changes — the dashboard briefly caches its data in your browser; a manual refresh (Ctrl+R) reloads it. Use it if you just imported a batch of items and the KPIs look a minute behind.
- Zero items / zero transactions — first-time users see a friendly empty state with a call-to-action pointing at the Quick Start. It isn't an error.
- Custom fields don't appear on the dashboard. If you need to chart by a custom field value, build a Report with a custom-field filter instead (see Reports).
- Currency changes don't repaint instantly. If you change the currency symbol in Settings while the dashboard is open, refresh to pick up the new format.