Reports & Analytics
Reports is Next Inventory's analytics view — derived entirely from your item records and the transaction audit log, with no report configuration needed. Four tabs answer the questions people actually ask: what do we have?, how is it distributed?, what's been moving?, and what's running out? Two further tabs appear when Inventory Costing is set to FIFO or LIFO — see The Costing Tabs below.
Open it from Components > Next Inventory > Reports.
For Users
The Four Tabs
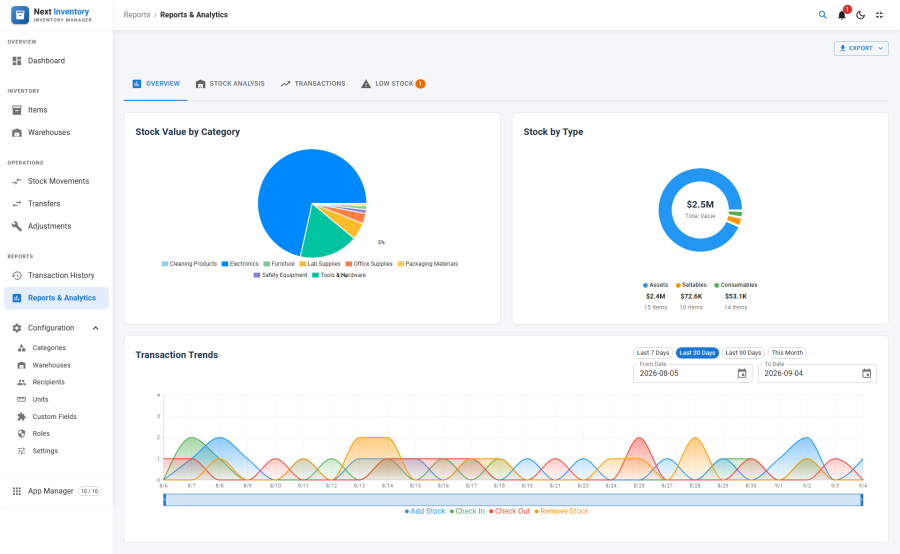
- Overview — headline KPIs and trend charts. Stock valuation by category, stock by item type, and transaction trends over the selected period.
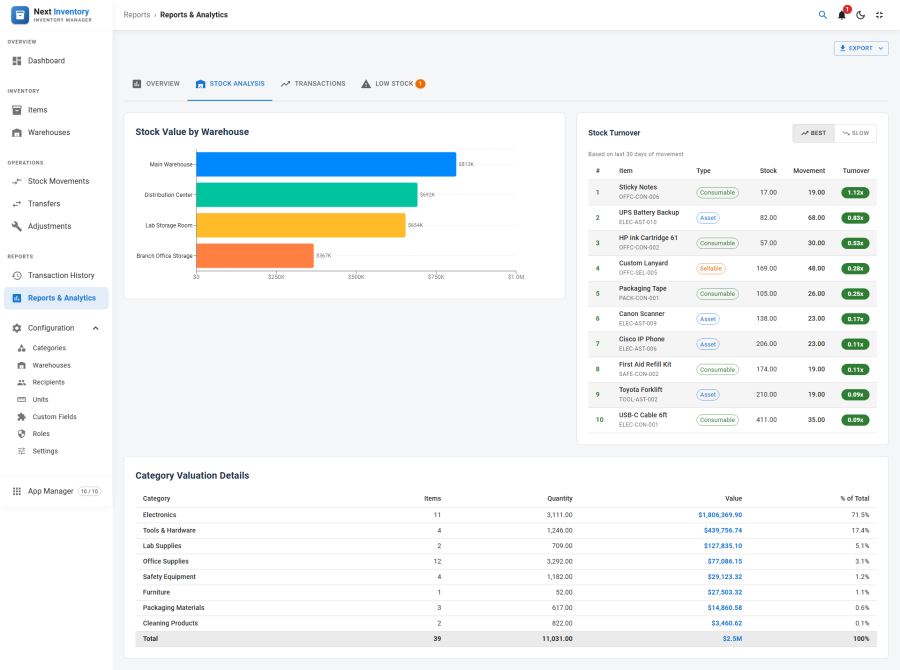
- Stock Analysis — distribution of stock by warehouse and item type, plus a stock-turnover table. Useful for answering "where's our value?" questions.
- Transactions — filtered audit-log view with date range, transaction type, item, and recipient filters. This is the read-heavy tab you'll use for investigations.
- Low Stock — every item currently at or below its threshold, with the shortfall surfaced. Badge on the tab shows the live count so you spot reorder work at a glance.
The Costing Tabs (FIFO and LIFO Only)
These two tabs are hidden on the default Standard costing method and appear the moment you set Inventory Costing to FIFO or LIFO in Settings. Standard costing values stock at each item's current unit price, so there are no cost layers to report on; FIFO and LIFO record a separate layer for every receipt of stock, and these tabs read them.
COGS Analysis
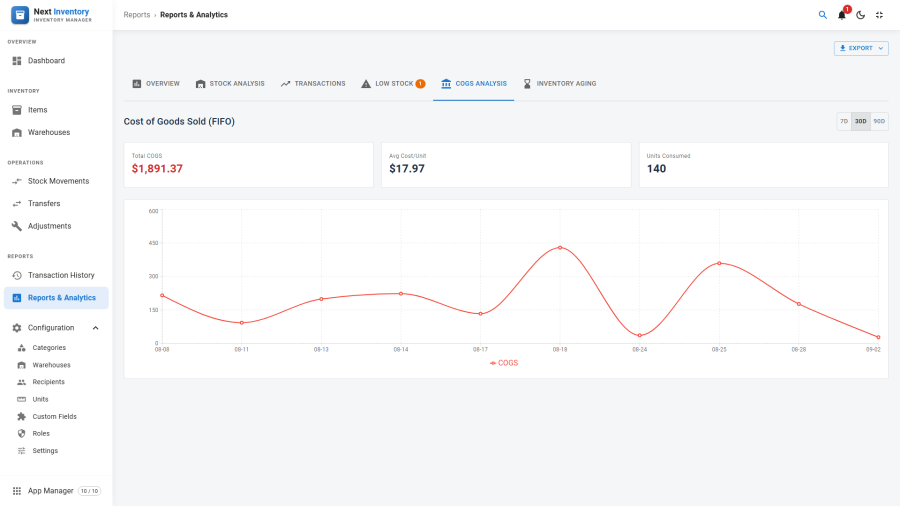
Cost of goods sold, headed with the method in force — Cost of Goods Sold (FIFO). Three figures across the top:
- Total COGS — the cost of everything consumed in the window, taken from the layers each movement actually drew down, not from current prices.
- Avg Cost/Unit — the average unit cost across those movements.
- Units Consumed — how many units left stock.
Below them, daily COGS as a trend line.
This tab has its own 7d / 30d / 90d toggle in the top right. It is independent of the Date Range control that drives the other tabs, so changing one does not change the other.
COGS is only recorded when stock leaves and consumes layers. A site that has just switched costing on has layers but no consumption yet, and reads "No COGS data for the selected period" until the first outgoing movement. That is expected, not a fault.
Inventory Aging
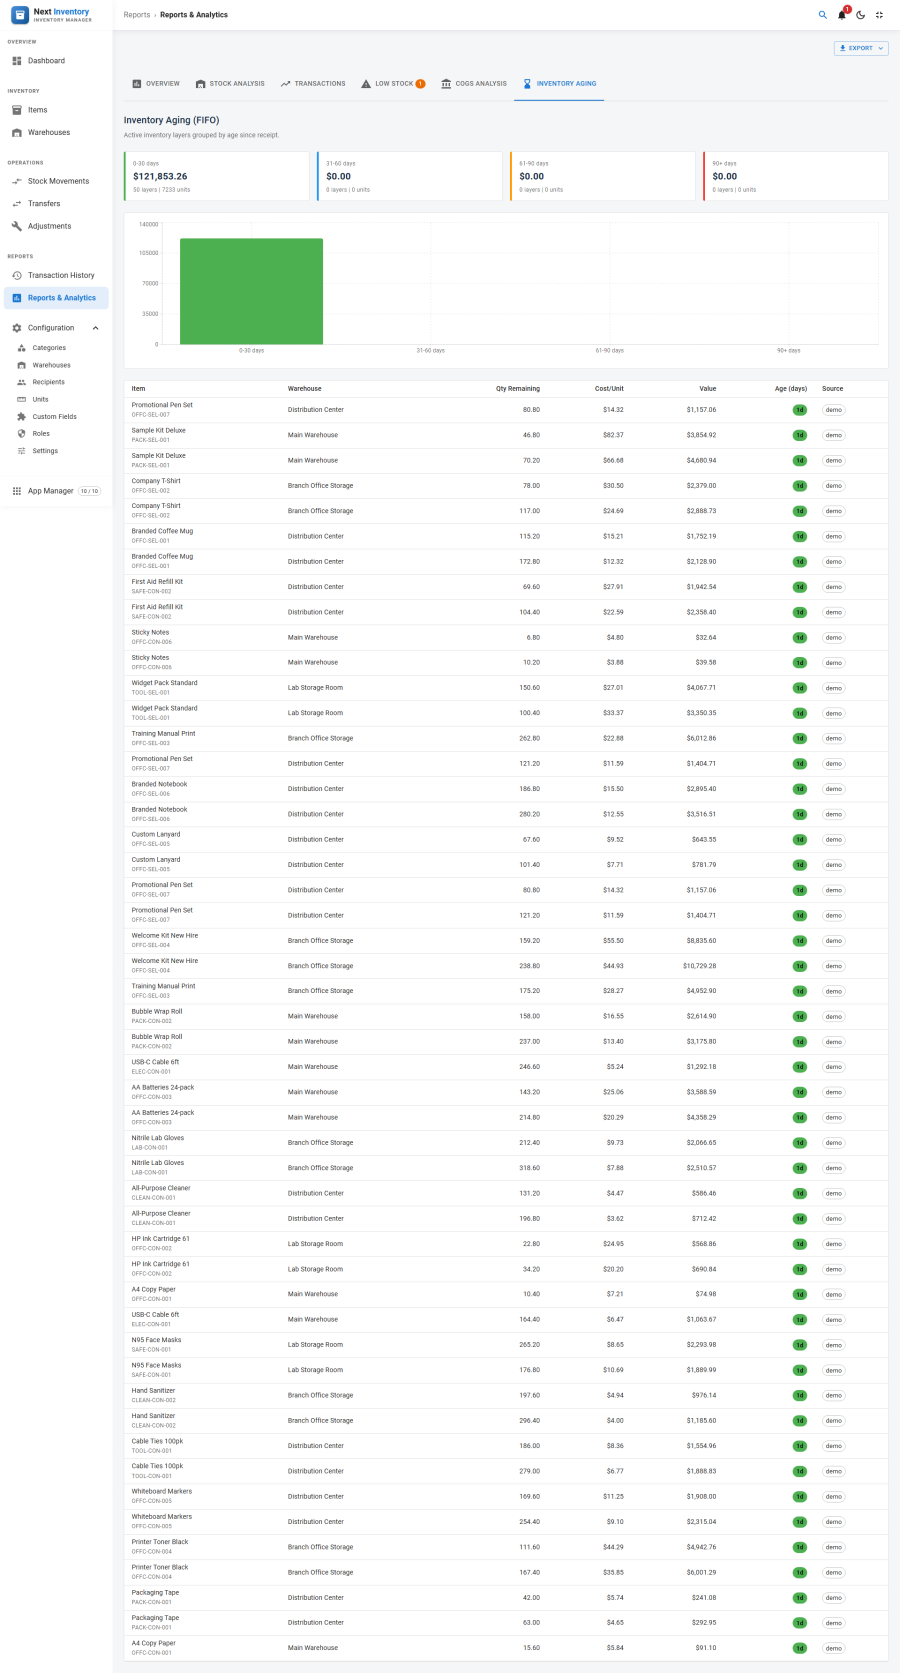
Active inventory layers grouped by age since receipt — the answer to "how long has this been sitting?". Four buckets, each showing its total value plus the layer and unit counts behind it:
| Bucket | Meaning |
|---|---|
| 0-30 days | Received within the last month |
| 31-60 days | One to two months old |
| 61-90 days | Two to three months old |
| 90+ days | Older than three months — the slow-moving tail |
A bar chart repeats the buckets, and beneath it every open layer is listed with its item, warehouse, remaining quantity, cost per unit, value, age in days, and the source that created it. The age chip is coloured by bucket, so old stock stands out while scanning. Long lists are capped on screen at the first 50 layers, with a count of the rest.
Only layers with quantity remaining appear; fully consumed layers drop off, which is why this total tracks stock on hand rather than everything ever received.
Choosing a Date Range
One Date Range control drives the charts and trend figures across the tabs. Set it with the From and To date pickers, or use a preset:
- Last 7 Days
- Last 30 Days — the default
- Last 90 Days
- This Month
The presets highlight while the dates still match them, so you can always see which one you are on. An end date earlier than the start date is rejected with "End date must be on or after the start date."
The same range drives the CSV exports, so a downloaded file always covers the period you were looking at.
Non-transaction KPIs (stock valuation, total items) ignore the range because they are current snapshots. Transaction-based metrics (movement trends, top movers) respect it.

Exporting
The Export button offers two downloads, both CSV, both generated on the server and delivered instantly:
- Export Inventory CSV — what you are holding right now.
- Export Transactions CSV — the movements behind it.
Exports respect the current filters and date range, so the file matches what you see on screen.
To share a report as a document rather than a spreadsheet, print the page and choose Save as PDF in your browser's print dialog. Reports are styled for printing: the navigation is stripped, the page is laid out landscape, and it always prints dark-on-white even when you are working in dark mode.
Common Workflows
- Monthly stock valuation — Overview tab, last 30 days, print to PDF from the browser, send to finance.
- "What categories are we heaviest in?" — Stock Analysis tab, scan the Category table, export CSV if needed.
- Tracking a specific recipient's loans — Transactions tab, filter by recipient, date range = year-to-date, export CSV.
- Year-over-year trend — 1y period on Overview, compare with prior snapshots you've exported in the past.
For Admins
What the KPIs Actually Count
- Stock Valuation — stock quantity times unit price, added up across every published item. Items with zero unit price contribute zero.
- Total Items — the number of published items (not a sum of stock quantities).
- Movement Trends — transactions in the selected period, grouped by date.
- Category / Warehouse / Type breakdowns — live totals of stock value (quantity times unit price), grouped by each item's category, warehouse, or type.
- Top Performers — items with the highest total quantity moved in the selected period, computed from the quantity on each transaction.
Accuracy Depends On…
- Unit prices being current. Reports derive value from each item's current unit price, not a historical price. If you change prices frequently and want historical accuracy, capture snapshot exports at known points and archive them — there's no built-in price history.
- The Low Stock Threshold field being set on items that matter. The low-stock count on the Overview tab only counts items with a threshold; items with no threshold never appear regardless of stock level.
- Published status. Only published items are included. Unpublished items don't exist as far as reports are concerned, which is usually the right behaviour.
Permissions
| Action | Feature | Permission |
|---|---|---|
| Open the Reports tab | reports |
view |
| Export CSV | reports |
export |
| See item / transaction detail click-throughs | inventory.view + transactions.view |
Users with view but not export see the data but not the Export
button — useful for read-only reviewers who should read the numbers
without circulating extracts of them.
Edge Cases
- Very large transaction histories (hundreds of thousands of entries) — the 1y period on Transactions can be slow. Prefer 30d or 90d for interactive work; use CSV export for full-year pulls, since it skips the on-screen rendering.
- Mixed-currency items — all items and reports use the single currency from Settings. Mixed- currency inventory requires you to normalise unit prices to one currency in the item records; Next Inventory doesn't convert.
- Decimal quantities in exports — the CSV export uses a
.decimal separator regardless of the locale setting in Settings, because comma decimals break CSV parsers. The on-screen display respects the locale. - Date ranges cross a daylight-saving change — dates you pick in the filters are treated in your local time zone, so range boundaries stay correct even across a clock change.
- Custom field filters — when a custom field is marked as filterable in its definition, it appears as a filter option in the Transactions tab. Non-filterable custom fields don't clutter the filter drawer.
Filter Reference
Reports has no form fields of its own — these are the filters you set on screen:
| Filter | What it does |
|---|---|
| Period | Sets the time window (7d / 30d / 90d / 1y) for charts and transaction-based metrics on every tab |
| Date From / Date To | Restricts the Transactions tab to an inclusive date range |
| Transaction Type | Shows only one type of movement — the same six types as the Transactions screen |
| Item | Restricts results to a single item |
| Recipient | Shows only check-outs and check-ins involving one recipient |
| Warehouse | Restricts results to a single warehouse |
| Created By | Shows only movements recorded by a particular Joomla user |