Analytics and Reports
Analytics answers two different questions. The first is how people are doing — pass rates, score distributions, individual progress. The second, and the one most assessment tools cannot answer at all, is whether your questions are any good.
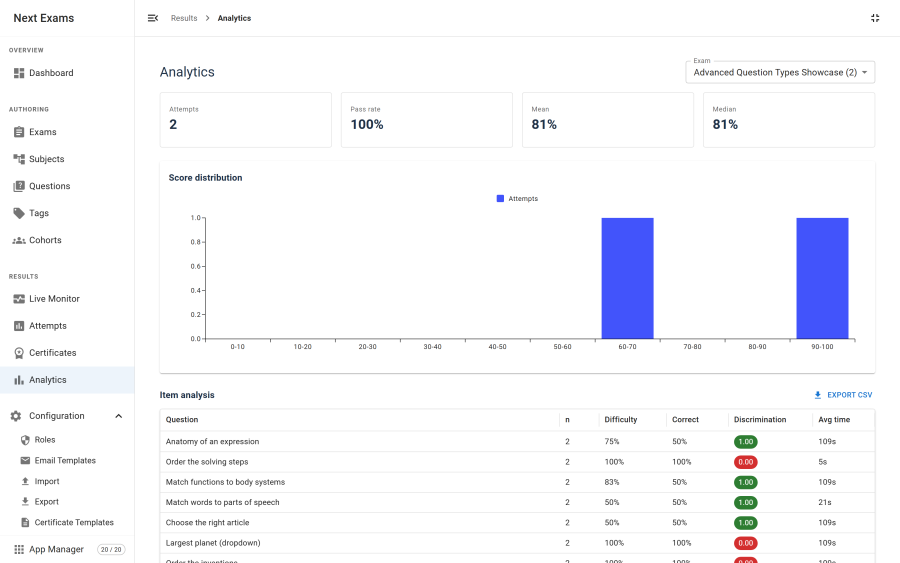
Exam overview
For any exam, the overview reports the shape of its results: how many attempts, how many passed, the average and distribution of scores, and how those numbers move over time.
This is also the source of the performance card on the exam detail view, so an author can see how an exam is performing without leaving the exam.
Item analysis
Item analysis evaluates each question in an exam against the attempts that have been made on it. Two numbers matter.
| Measure | What it tells you | How to read it |
|---|---|---|
| Difficulty | The proportion of candidates who answered correctly | Very high means almost everyone got it; very low means almost nobody did. Either way it separates nobody. |
| Discrimination | How well the question separates strong candidates from weak ones, measured as the correlation between getting this item right and scoring well overall | High is good. Near zero means the question is measuring something unrelated to the rest of the exam. Negative is a warning — your strongest candidates are getting it wrong, which usually means a miskeyed answer or an ambiguous stem. |
A negative discrimination on a question everybody found easy is the classic signature of a wrong answer key. Item analysis is the fastest way to find one.
Note: these statistics need data. A question answered by five people tells you very little. Treat the numbers as indicative until an exam has been sat enough times for them to settle.
Per-student reports
Every attempt one person has made, across exams, with their scores and how they have moved over time. Useful for a tutor conversation, and for spotting a candidate whose results suddenly change character.
CSV export
Two exports, both respecting the filters you have applied on screen:
| Export | Contains |
|---|---|
| Attempts | One row per attempt — examinee, exam, status, score, maximum, percentage, pass state, time spent, submitted time |
| Analytics | The report you are looking at, as data |
Exports open as a direct download. Because the whole filtered set is exported rather than the visible page, exporting a large, unfiltered attempt list is a heavy operation — filter first.
Scheduled reports
A report can be built and emailed automatically on a schedule you define. Create the schedule, choose the report and the recipients, and set the cadence.
Warning: scheduled reports are sent by a Joomla scheduled task that you must create yourself, and they are sent through the notification system. If either the task does not exist or notifications are switched off, reports are silently not sent. See Scheduled tasks.
Access control
| Action | Required permission |
|---|---|
| View analytics | reports — view |
| Export a report or attempts CSV | reports — export |
| Manage report schedules | reports — export |
Permission is checked on reads as well as writes, and pages that combine analytics with other data degrade rather than fail: the exam detail view simply omits its performance card for a user without reports view permission, instead of showing an error.
Analytics is a switchable app. With it off, the interface and its endpoints go away; the underlying attempt data is untouched and reappears intact when it is re-enabled.