Reports
Because every channel writes the same order record, reporting doesn't need to reconcile anything. A QR order, a delivery order and a check rung up at the counter are all in the same numbers.
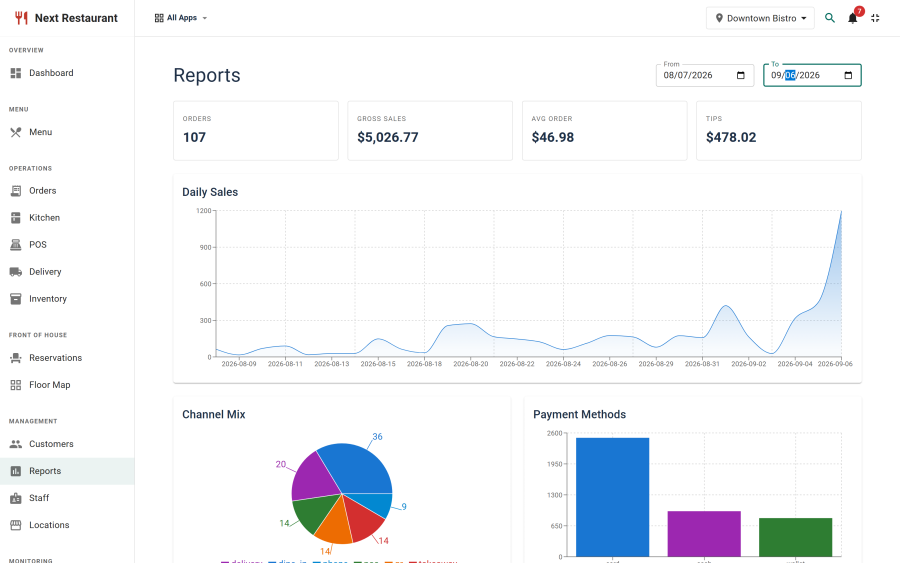
Reports takes a date range and produces the following.
Sales summary
The KPI strip for the selected period:
| Metric | Meaning |
|---|---|
| Orders | How many orders completed |
| Gross sales | Total revenue before refunds |
| Average order value | Gross sales divided by orders |
| Tips | Tips taken over the period |
| Refunds | Money handed back during the period, counted on the day each refund was issued — not the day of the payment it reverses |
| Comps | The value of items comped on the period's orders |
Top items
What sold, by quantity and by revenue. The two orderings answer different questions — the highest quantity is what the kitchen is making all night; the highest revenue is what is paying the rent. Reading them side by side is usually more informative than either alone.
Payment breakdown
Revenue split by settlement type — cash, each card provider, gift card, voucher, on-account. This is the report to reconcile the drawer against, and the one that tells you what your card processing actually costs you as a share of takings.
Refunds are netted out on the day they were issued, against the method the money went back through. A refund given today for last week's meal reduces today's figure, so a day you have already closed never changes after the fact.
Channel mix
Where the orders came from: online, QR table ordering, POS, phone and delivery.
Channel mix is the number that justifies the whole system. If a third of revenue is arriving through your own storefront and QR codes rather than a marketplace, that is commission you are no longer paying, and it is visible here.
Staff hours
Hours worked and labour cost per staff member for the period, drawn from clock-in and clock-out events on the time-clock terminal.
Set against the sales summary for the same range, it gives labour as a percentage of revenue without exporting anything to a spreadsheet.
Ingredient usage
What was consumed and what it cost, computed from recipe depletion and waste movements. Available where the inventory module is enabled and items have recipes.
This is theoretical usage measured against actual movements — so the gap between what should have been used and what actually left the shelf is visible rather than assumed.
Live snapshot
A current-state view rather than a historical one: what is happening right now — open orders, what is in the kitchen, what is ready. The dashboard uses the same data for its live feed and alerts widget.
Audit log
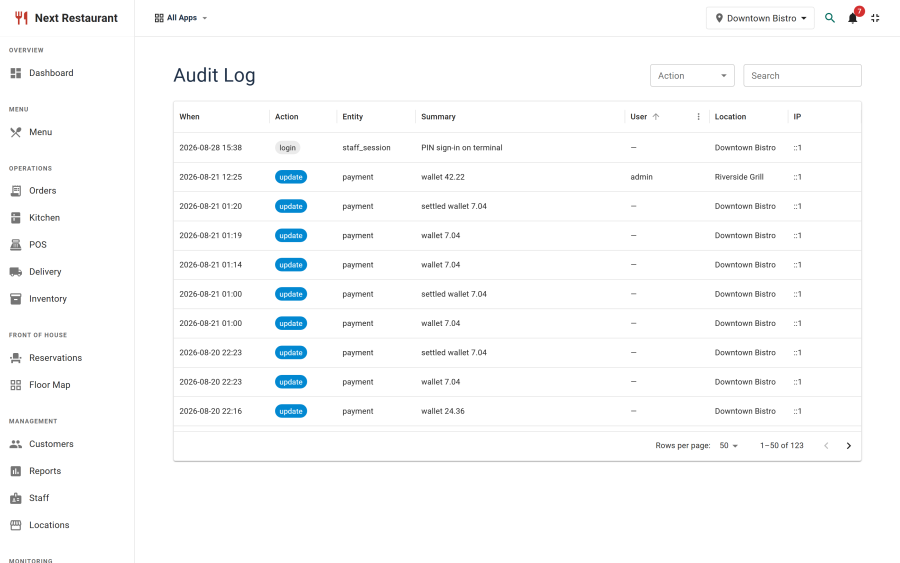
Audit Log records privileged actions — corrections, comps, discounts, voids, refunds, permission changes — with who did them, when, and what the manager PIN authorised.
It is filterable by type, user and date. This is where "we comped £340 last month — on what?" is answered.
Access
Reports are gated on the reports feature, with separate view and manage / export actions — so a shift manager can read the numbers without being able to export them.
The payments ledger is deliberately not part of this. It is gated on the payments feature instead, so someone who reconciles the till each night gets the transactions they need without access to sales analytics. See Payments.
Exporting
Where a report supports export, it produces CSV of the filtered set — the same rows you are looking at, not a different query. The payments ledger exports the same way.
See also
- Payments — the transactions ledger and refunds
- Inventory — where ingredient usage comes from
- Order Corrections — what fills the audit log
- Roles & Permissions — who can see the numbers